Data Checking:
Boxplots were initially used as a visual check for the nature of distributions, outliers and comparing classes or treatments.
Boxplots were initially used as a visual check for the nature of distributions, outliers and comparing classes or treatments.
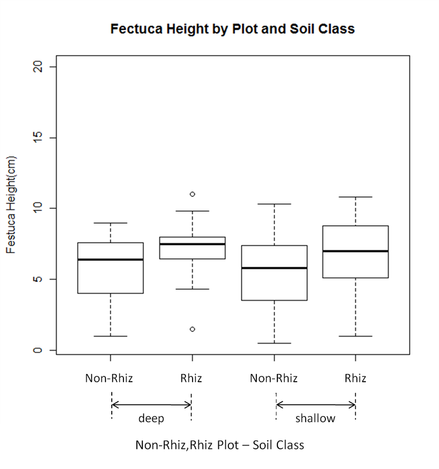
This boxplot shows the distribution of Festuca height in rhizomatous and non-rhizomatous plot and deep and shallow soil.
This plot shows that the distribution of Festuca height is nearly normal. Some outliers can be seen, also due to measurement error one outlier was removed.
For testing the assumption of normality checking the residuals and Shapiro test were performed as well(figure 9).
In addition, the distribution of height in shallow and deep soil is similar, while it is different in rhizomatous and non-rhizomatous plot.
Figure 7: Distribution of Festuca height by rhizomatous and non-rhizomatous plot and deep and shallow soil. The distribution of Festuca height is normal.
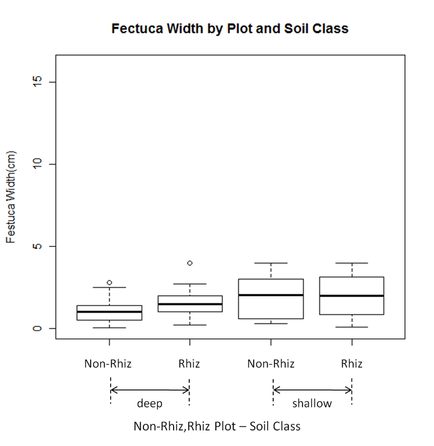
This boxplot shows the distribution of Festuca width in rhizomatous and non-rhizomatous plot and deep and shallow soil.
This plot indicates that the distribution of Festuca width is not normal. Some outliers can be seen, also due to measurement error one outlier was removed.
In addition, to examine the assumption of normality checking the residuals and Shapiro test were applied(figure 12).
According to this boxplot, the distribution of width in rhizomatous and non-rhizomatous plot is similar, while it is different in deep and shallow soil.
Figure 8: Distribution of Festuca width by rhizomatous and non-rhizomatous plot and deep and shallow soil.The distribution of Festuca width is not normal and data transformation should be apply.
" This is a class exercise based on modified or randomly generated datasets. "
