Methods and Data:
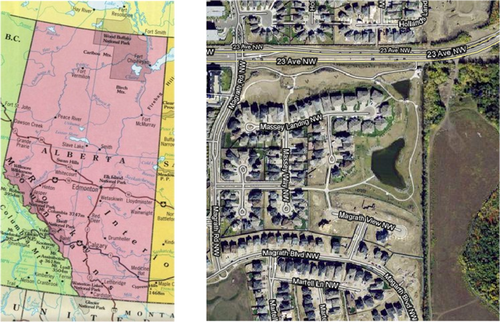
Figure 5: Site location (Google Maps, 10/31/10).
The experimental field of this study is located in residential development area in south Edmonton, Alberta, Canada. Ecological theory to rebuild a native ecosystem (grassland) to reduce the impacts of urbanization has been applied. The ecosystem of this area is based on Rough-Fescue Prairie. In this site 20 monitoring blocks of plant community pairs with matching communities have been set up. Each block has been located in different soil depth with the range of 10 to 150 cm in grassland. Each block has 2 plots (Rhizomatous and Non-Rhizomatous community):
-Non-Rhizomatous community can regenerate sexually (only by seed),
-Rhizomatous community can regenerate vegetatively and sexually,
Also 2 species (Festuca hallii and Hedysarum) have been planted in each plot as a phytometer to study if plant community affects them differently, or interacts with soil depth or other factors."Phytometer is a group of plants used to measure the physical factors of the habitat in terms of physiological activities" (Canada Department of Agriculture, 1976).
Festuca hallii was selected because it is a 'late successional' grass in Rough Fescue prairie, dominates ungrazed grasslands, and cannot be obtained commercially by seed. Hedysarum boreale is an N-fixer, and an important ecological functional species.
Each plot consists of 4 smaller blocks and all the 4 blocks of each plot have the same pattern of planting. Therefore, randomized complete blocks distribution (RCB) have the same arrangement and Festuca is surrounded by specific species in each location. Thus, Festuca is exposed to certain competition but not all species.
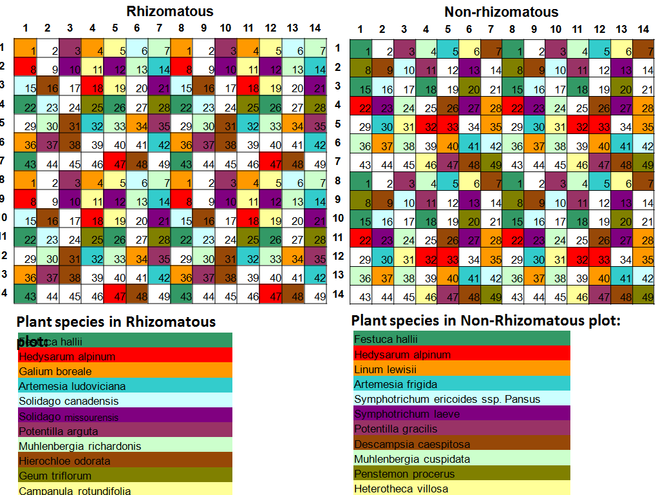
Figure 6: Pattern of planting in each block with different species (each block has 2 plots).
To find whether soil depth and plant communities affect Festuca growth, height and width of Festuca in blocks 3 and 4 (deepest blocks with less than 150 cm soil) and blocks 7 and 14 (most shallow blocks with less than 20 cm soil) have been measured.
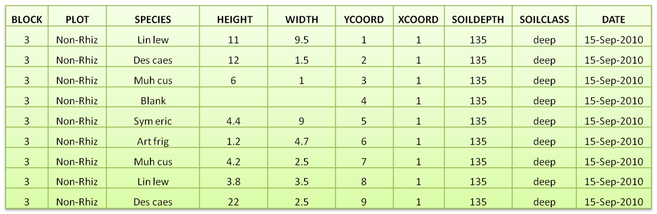
Table 1: Sample data table for statistics analysis.
Table 1 shows an example of the data that was used in the analysis. The response variables are height and width. The predictor variables are plot (rhizomatous and non-rhizomatous community), soil depth and soil class. Festuca Hallii has been selected from the species for doing statistics analysis to see the effects of soil depth and plant community on its growth.
