Statistical test:
In this experiment statistical analysis was performed using multi_way ANOVA to determine the effects of soil class (deep and shallow) and plant community (rhizomatous and non-rhizomatous plot) on Festuca growth.
Null hypothesis: Festuca growth including height and width in different soil depth and in different plant community (rhiz and non-rhiz) will be the same.
Alternative hypothesis: Festuca will have different growth in different soil depth and different plant community. Higher growth of Festuca in deep soil and in non-rhiz community.
There were 4 treatments due to combination of soil class (deep, shallow) and plant community (rhiz, non-rhiz); therefore multi-factor ANOVA was appropriate to analyze the effects of soil class and plant community. Before performing the ANOVA test, normality and homogeneity of variance should be tested. For non-normal data, data transformation must be applied. Data transformation can consistently alter data to help it meet some criteria. Also change the weakness to the most useful (improve our data). Multi -way ANOVA can be used after satisfying the assumptions of normality and homogeneity of the data.
To determine the effects of soil class and plant community on Festuca growth, multi -way ANOVA were examined separately for height and width of Festuca.
1) Festuca height analysis:
Checking the residuals and Shapiro-Wilk test were used for testing normality (figures 9,10,11). P-value of Shapiro test was 0.1516; therefore the data met the assumption of normality.
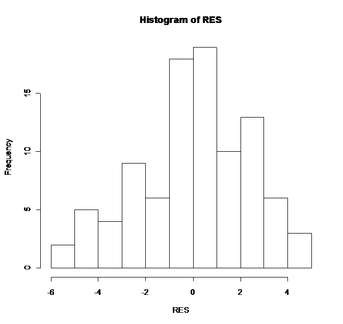
Figure 9: Histogram of residual for Festuca height. The shape of this plot indicates that the data are normally distributed.
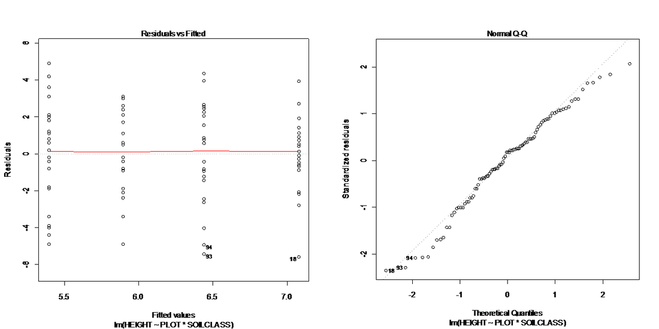
Figure 10 Figure 11
Figure 10 : Residual plot for Festuca height. The data meet assumption of normality due to equal distribution of data points around the center line.
Figure 11 : Normal Q-Q plot of Festuca height. The linearity of the points suggests that the data are normally distributed.
Figure 11 : Normal Q-Q plot of Festuca height. The linearity of the points suggests that the data are normally distributed.
To examine the assumption of homogeneity of variance, Bartlett test was examined separately for plot and soil class. P-value for height by plot was 0.5299 and for height by soil class was 0.09167. These p-values indicated that the data met the requirement of homogeneity.
After meeting the assumptions, multi-way ANOVA was used to determine which treatment has a significant effect on Festuca height. Results can be seen in table 2.
Response: HEIGHT
After meeting the assumptions, multi-way ANOVA was used to determine which treatment has a significant effect on Festuca height. Results can be seen in table 2.
Response: HEIGHT
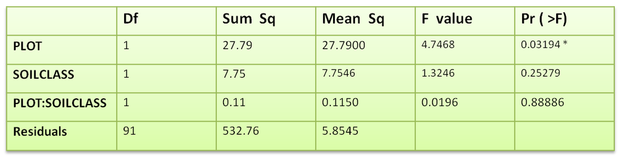
Table 2 : Multi factor ANOVA table for Festuca height
These results indicated the significant effect of plot (rhiz and non-rhiz community) on Festuca height, in other word the main effect was plot and there was no interaction effect.
2) Festuca width analysis:
Normality was tested by examining the residuals and Shapiro-Wilk test (figures 12,13,14). The data did not meet normality requirements, for this reason data transformation was applied. After applying square root transformation, data became more normal.P-value for the Shapiro test after data transformation was 0.007689 Shapiro test is very sensitive for large sample size and also ANOVA test is robust, thus I continued my statistical test by ANOVA test.
Normality was tested by examining the residuals and Shapiro-Wilk test (figures 12,13,14). The data did not meet normality requirements, for this reason data transformation was applied. After applying square root transformation, data became more normal.P-value for the Shapiro test after data transformation was 0.007689 Shapiro test is very sensitive for large sample size and also ANOVA test is robust, thus I continued my statistical test by ANOVA test.
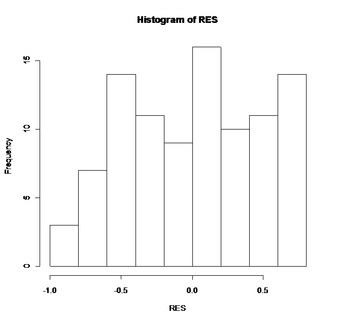
Figure 12: Histogram of residual for Festuca width after square root transformation. The data become more normal after applying transformation.

Figure 13 Figure 14
Figure 13: Residual plot for Festuca width. Distribution of data points around the center line shows that the data become nearly normal after square root transformation.
Figure 14: Normal Q-Q plot of Festuca height after square root transformation. The linearity of the points indicates that the distribution of data is nearly normal.
Figure 14: Normal Q-Q plot of Festuca height after square root transformation. The linearity of the points indicates that the distribution of data is nearly normal.
Bartlett test was used to examine the assumption of homogeneity of variance. P-value for sqrt_width by plot was 0.5982 and for sqrt_width by soil class was 0.2379.Due to these p-values the data met the requirement of homogeneity.
To identify which treatment had a significant effect on Festuca width, multi-way ANOVA was performed. Results can be seen in table 3.
Response: sqrt_WIDTH
To identify which treatment had a significant effect on Festuca width, multi-way ANOVA was performed. Results can be seen in table 3.
Response: sqrt_WIDTH
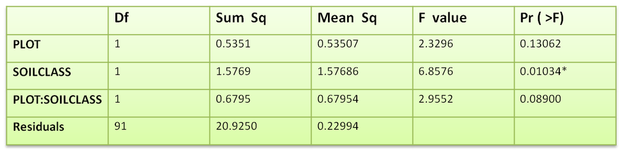
Table 3: Multi factor ANOVA table for Festuca width
These results showed the significant effect of soil class (deep and shallow) on Festuca width. Soil class was main effect and there was no interaction effect.
In addition, multi-way ANOVA was performed for height of all species to analyze other species with respect to soil depth and plant community effects.
3) Analysis of all species height:
Checking the residuals and Shapiro-Wilk test were repeated to examine the assumption of normality(figures 15,16,17). The data did not meet normality requirements, so log transformation and adding constant (1.5) were applied and the p-value after transformation was 5.114e-07. The shape of histogram of residuals seemed normal, thus the p-value did not considered.
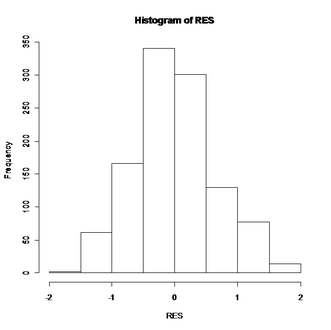
Figure 15: Histogram of residual for height of all species. Shape of this plot indicates that the data turn to normal distribution after applying log transformation and adding constant.
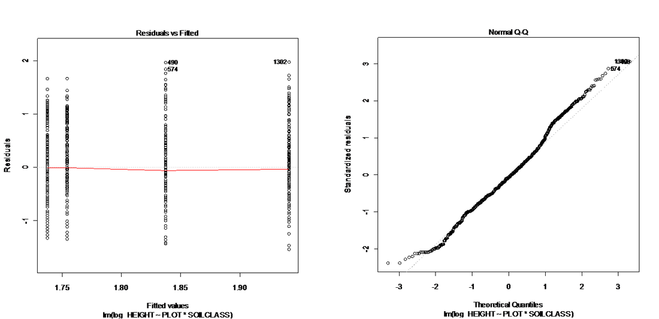
Figure 16 Figure 17
Figure 16: Residual plot for height of all species after applying log transformation. Distribution of data points around the center line shows that the data become normal.
Figure 17: Normal Q-Q plot for height of all species after applying log transformation. The linearity of the points indicates that the distribution of data is nearly normal.
Figure 17: Normal Q-Q plot for height of all species after applying log transformation. The linearity of the points indicates that the distribution of data is nearly normal.
Bartlett test was used for testing the assumption of homogeneity of variance. P-value was 0.04629 and 0.1534 for log_height by plot and log_height by soil class, respectively. So, the data met the requirement of homogeneity.
Multi-way ANOVA was tested to examine the effects of soil depth and plant community on all species height. Results are listed in table 4.
Response: log_HEIGHT
Multi-way ANOVA was tested to examine the effects of soil depth and plant community on all species height. Results are listed in table 4.
Response: log_HEIGHT
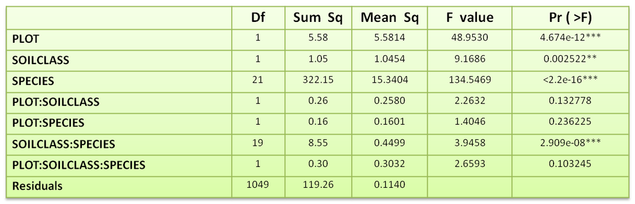
Table 4: Multi factor ANOVA table for all species height
These results illustrated the significant effects of plot, soil class, species and soilclass-species. Plot, soil class and species were main effects and also there was an interaction between soil class and species. Significant interaction can cause to disregard a significant main effect.
According to the interaction plot, some species were taller in shallow soil than in deep soil like Campanula and Heterotica, while in some others there were no interactions (figure 18).
According to the interaction plot, some species were taller in shallow soil than in deep soil like Campanula and Heterotica, while in some others there were no interactions (figure 18).
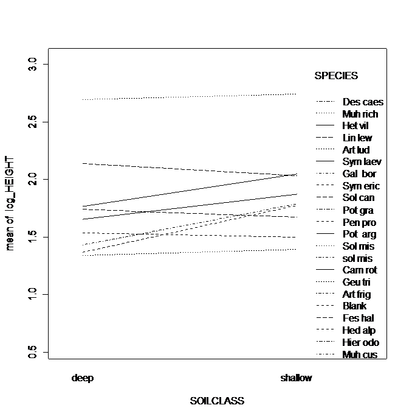
Figure 18: Interaction plot shows the interactions between soil depth and different species. Height of some species is larger in shallow soil than in deep soil like Campanula and Heterotheca, while in some others there is no interaction.
Moreover, Blocking test was performed because the experimental design of this study was based on block design. Blocking can be used to make our test more powerful. Following blocking test the p-value for the treatment effect became smaller. For example for Festuca height the p-value after doing blocking test was decreased from 0.03194 to 0.02411548 (made our test more powerful).
